|
NSCL DDAS
1.0
Support for XIA DDAS at the NSCL
|
|
NSCL DDAS
1.0
Support for XIA DDAS at the NSCL
|
This document describes the simplest DDAS setup: A single PXI crate with one digitizer. Throughout, there will be suggestions on how to expand this setup so that it has several digitizers.
Other simple setup documents will describe
This material is organized as follows:
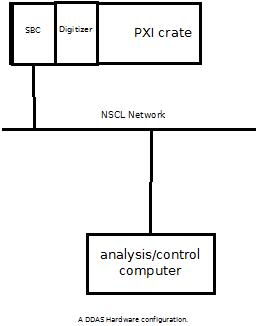
DDAS data acquisition and online analysis rely on several hardware and software components.
The figure below shows a simple DDAS hardware configuration:
The figure below shows a simple DDAS software configuration emphasizing the data flow.
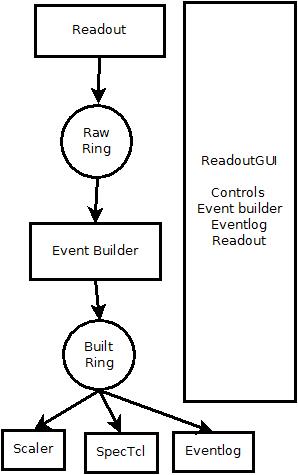
A few points are worth noting:
Finally a bit about where the DDAS support software is installed at the NSCL. The NSCL may have several versions of the DDAS software installed concurrently. In general these will be installed in
/usr/opt/ddas/version
Where version above is a software version number of the form major.minor-editlevel major, minor and editlevel are three numbers that are called the major version the minor version and the edit level. Edit level changes reflect defect fixes and very small enhancements. minor version changes reflect enhancements and fixes that are somewhat more involved. Migrating to versions where only the minor version changed will at most require you to recompile without any need to modify your code. Major version changes very significant fixes and enhancements that may require recompilation of any user level code.
In addition to these there is a symbolic link /usr/opt/ddas/current that points to the version of the DDAS software that is recommended for use. This link will only change during significant accelerator shutdowns.
Each version's top-level directory includes a script ddassetup.bash
Source that script into your interpreter to setup several environment variables:
DDAS_ROOT - points to the top level ddas installation directory (that's the directory that holds the ddassetup.bash script).DDAS_BIN - points to $DDAS_ROOT/bin this directory contains all executable programs.DDAS_LIB - points to the $DDAS_ROOT/lib directory. This contains all of the link libraries DDAS applications might need to link against.DDAS_INC - points to $DDAS_ROOT/include a directory that contains all header files DDAS applicatons may need.DDAS_SHARE - points to $DDAS_ROOT/share this directory tree contains documentation, program skeletons and scripts.The remainder of this document will assume that you have selected a DDAS version and sourced its ddassetup.bash script into your shell.
Communication with the Pixie-16 modules requires communication over the PXI backplane. In any of the DDAS systems at the NSCL, whether using a fiber interface of embedded single board computer (SBC), a PLX 9054 chip is involved in this communication. There is a kernel module that must be loaded into the kernel prior to using this chip. You can load it by :
sudo /usr/opt/plx/Bin/Plx_load 9054
You will be asked to enter you password and then on success you will get the following output written to the terminal
Install: Plx9054
  Load module......... Ok (Plx9054.ko)
  Verify load......... Ok
  Get major number.... Ok (MajorID = 251)
  Create node path.... Ok (/dev/plx)
  Create nodes........ Ok (/dev/plx/Plx9054)
The user must load the PLX kernel module before using DDAS after every time the computer is booted.
Many of the DDAS software components require a set of configurations files to be in the current working directory. These configuration files describe the configuration of modules in a crate and point at a settings file containing the parameters used by the digital pulse processing (DPP) algorithms for each module in use.
These files are described in the documentation of readout . This section will summarize the files needed for nscope. By convention a directory subtree is used to hold the configuration files for each crate. The tree looks like this:
home-directory
     |
     +-- readout
            |
            +--- crate_1  (configuration for crate 1).
            +--- crate_2  (configuration for crate 2 if needed).
            ...
            +--- crate_n  (configuration for last crate, n).
Since we only have a single crate, this should look like:
Home directory
   |
   +---readout
          |
          +--- crate_1
                 +--- cfgPixie16.txt
                 +--- pxisys.ini
                 +--- crate_1.set
                 +--- modevtlen.txt
The directory $DDAS_SHARE/readout/crate_1 has sample configuration files.
cfgPixie16.txt - Indicates which modules are in which crates.pxisys.ini - Describes the PCI layout of the crate for the XIA API.crate_1.set - A parameter settings file.modevtlen.txt - Describes the number of 32-bit words in an event for each module.Once you've created ~/readout/crate_1 finish making the structure below by
cp $DDAS_SHARE/readout/crate_1/* ~/readout/crate_1
Of these files:
pxisys.ini must not be modified unless you are using a non-standard crate.cfgPixie16.txt must be modified to reflect the layout of modules in your crate and the actual desired name of the parameter settings file. nscope and Readout both use this file.crate_1.set should be renamed to match the final settings file path name in .txt This settings file contains the DPP parameters nscope and Readout load into the digitizers and is written by nscope if desired.modevtlen.txt must be modified to reflect the actual event sizes selected for each module. This must be modified to reflect the number of modules in cfgPixie16.txt and the sizes must be modified appropriately if waveforms are being acquired.To set up the hardware of a DDAS single crate, single card system you must
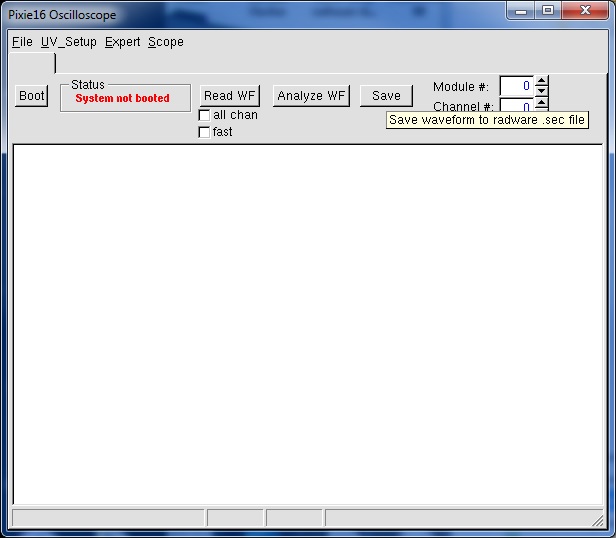
The nscope program is used to view input waveforms and set digital signal processing parameters. It should be run by
$DDAS_BIN/nscope The terminal window in which you run nscope will output a bunch of stuff. The main bits you want to look at are the crate map that is printed out. This will look something like
...
Reading config file... cfgPixie16.txt

7 modules, in slots: 2 3 4 5 6 7 8

current working directory /scratch/fox/daq/DDAS/main/readout/crate_1
...
where the current working directory should confirm that you are in the correct directory for the crate you are working in and the module map should match the crate you are working in as well (in the example shown that you have 7 modules in slots 2-8).
The minimum set of tasks you must perform are to:
Note that the nscope program controls many more parameters of the DPP algorithm. See nscope for more information about what the nscope program can do.
Set up your pulser to output pulses that rise quickly but have about a 50μsec fall time. The pulse polarity should be – with an amplitude no larger than 1V. For our test we'll use a 0.5V signal with a rise time of – and a fall time of 50μsec.
When using several DDAS cards it is important to synchronize the digitizer clocks between them. This is done by setting the jumper block JP01 appropriately. The jumper block is just a set of pins located on the board near the backplane connectors. Configure the connections between these pins with jumpers. In case your setup consists of a single module, be sure to configure the jumpers to match the top diagram for PXI clock master.
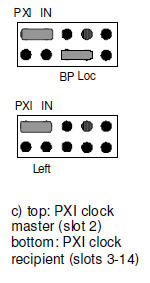
In this mode, the digitizer drives the clock on the PXI backplane with its own internal clock, and then reads it in from the backplane.
If you have several modules you must:
Our simple setup uses a single digitizer module in slot 2 of the PXI crate. We are also going to use the DPP settings file crate_1.set This means our cfgPixie16.txt file will look like this:
1     # Crate number 1
1     # One module.
2     # slot we've loaded the module into.
crate_1.set
nscope ignores this line as it is an inherently single crate system.nscope will load the settings contained in the file crate_1.set to configure the Pixie-16 modules during the Boot sequence.Let's walk through the minimum steps required in nscope to set up the readout properly.
First click the Boot button at the left of the user interface. This
Here is some sample output from a successful boot of our single module:
Booting all Pixie-16 modules...

Booting Pixie-16 module #0, Rev=12, S/N=175, Bits=12, MSPS=100
ComFPGAConfigFile:  /usr/opt/ddas/firmware/1.0-000/firmware/syspixie16_current_14b100m.bin
SPFPGAConfigFile:   /usr/opt/ddas/firmware/1.0-000/firmware/fippixie16_current_14b100m.bin
DSPCodeFile:        /usr/opt/ddas/firmware/1.0-000/dsp/Pixie16_current_14b100m.ldr
DSPVarFile:         /usr/opt/ddas/firmware/1.0-000/dsp/Pixie16_current_14b100m.var
--------------------------------------------------------

Start to boot Communication FPGA in module 0
Start to boot signal processing FPGA in module 0
Start to boot DSP in module 0
Boot all modules ok
DSPParFile:        ./crate_1.set
If the boot fails with an error, more detailed error messages will be written to Pixie16msg.txt
In order to set the waveform conditioning parameters, you must look at a waveform. Click the Read WF button. If the digitizer does not capture a full waveform, click it again until one is captured.
For the pulser I used, here's a sample picture:
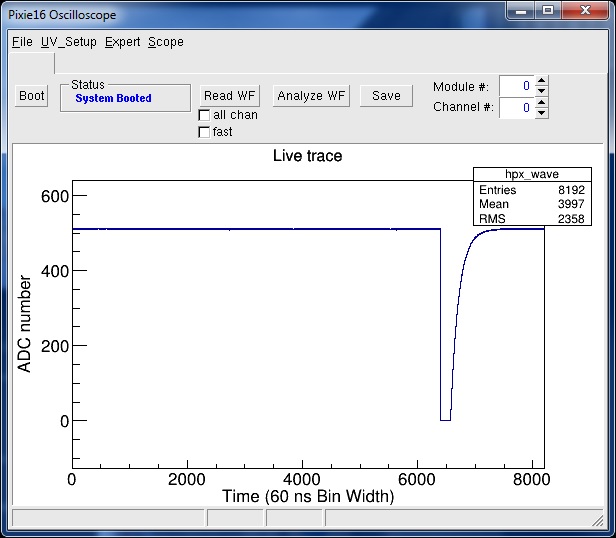
There are two things wrong with this signal:
Click the UV_Setup->Analog Signal Conditioning menu entry. This brings up a screen that looks like this:
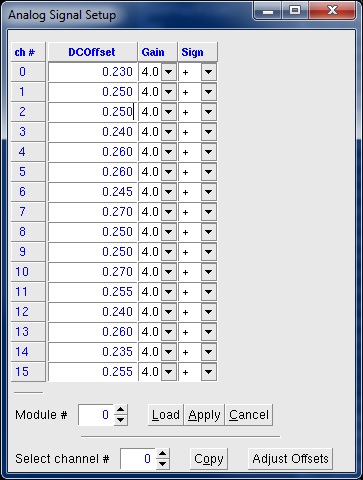
Our pulser is plugged into channel 0 which has the Sign set to + Using the pull down on that channel to set the sign to - (be sure to click Apply to write the setting into the module) and acquiring another trace gives:
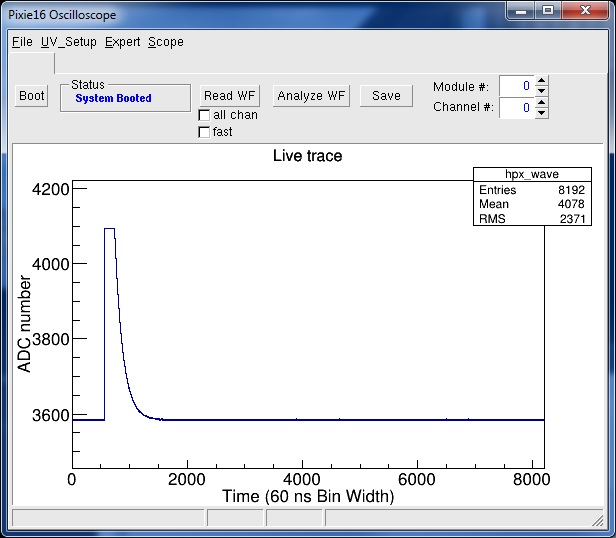
Our trace is still saturating the ADC. We'll next adjust the trace baseline. Do this by clicking the Adjust Offsets button of the Analog Signal Setup control panel.
Reading another waveform then gives:
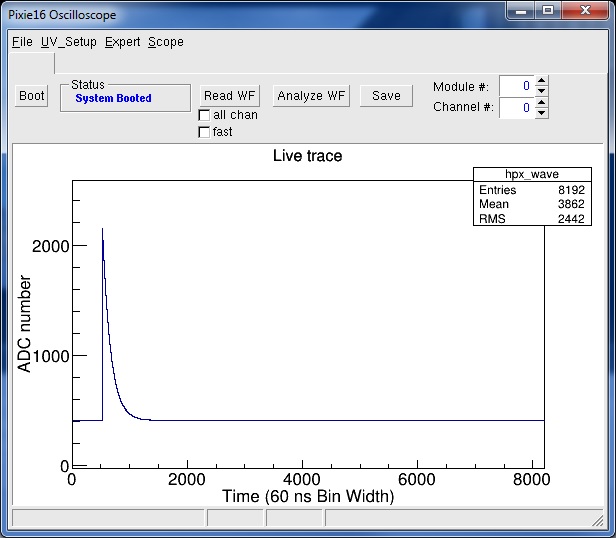
Our next step is setup the constant fraction (CFD). nscope can compute the parameters it thinks are appropriate. Click the Analyze WF button. The terminal window will output something like:
Filter parameters (From Modules):
    ADC sample deltaT (ns): 60
    Fast rise (ns):         500
    Fast flat (ns):         100
    Energy rise (ns):       6000
    Energy flat (ns):       480
    Tau (ns):               40320
    CFD delay:              80
    CFD scale:              0
Trigger Filter Rise Time is NOT an integer number of dT.  Fixing Now.
Trigger Filter Gap Time is NOT an integer numnber of dT. Fixing Now.
Energy Filter Rise Time is NOT an integer number of dT.  Fixing Now.
CFD Delay is NOT an integer numnber of dT. Fixing Now.
Filter parameters used for ''Analyze Waveform''
Note: Parameters have NOT been altered for the aquisition
    Fast rise (ns):         540
    Fast flat (ns):         120
    Energy rise (ns):       6000
    Energy flat (ns):       480
    CFD delay (ns):         120
Baseline: 410
Since we chose a signal with a good rise and fall time initially, we only care about the computed CFD delay. Click the UV_Setup->CFD to bring up the CFD control panel:
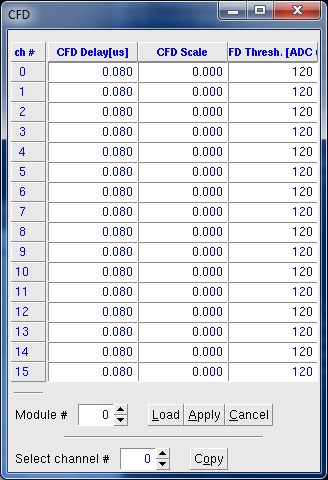
Apply the settings. Finally enable the CFD by selecting UV_Setup->CSRA and setting the CF bit in all of the channels for which you are going to use the CFD.
Now that the trigger is set up, you can take data and look at the module histograms. Use the menu entry Expert->Start Run to cause the module to start taking triggers and histogram the energies computed from the waveforms. The Read Histo button will read and display the channel energy histogram accumulated by the module. For my pulser I got:
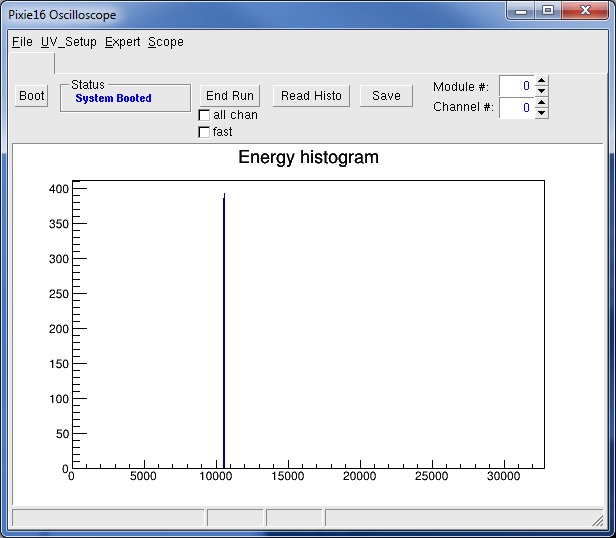
Stop data taking by clicking the End Run button. Normally, you need to repeat the process described above for each channel you are using.
Once all channels are set up, save the settings using the UV_Setup->Save2File menu command. In the file selection dialog that pops up, choose the .set file you specified in your cfgPixie16.txt file. This file will be loaded into the modules automatically when they are booted next.
Once you have a good settings file, you can take data with Readout. In this section we will:
For full documentation of the Readout program, see readout
The DDAS readout program does not need to be modified by you. It uses a set of configuration files that are expected to live in the current working directory when Readout is run:
The directory $DDAS_SHARE/readout/crate_1 has sample configuration files.
cfgPixie16.txt - Indicates which modules are in which crates.pxisys.ini - Describes the PCI layout of the crate for the XIA API.crate_1.set - A parameter settings file.modevtlen.txt - Size of events from each module.The pxisys.ini file normally does not need to be changed. The crate_1.set file was produced by nscope in the previous section. cfgPixie16.txt was edited to be correct in the previous section as well. The file modevtlen.txt must be edited to reflect the size of the event we expect from each module.
We are using only a single module and not taking waveforms from that module. Since the modevtlen.txt file format is simply the size of an event, in 32-bit units, from each digitizer's channels, one digitizer per line, in the same order as the cfgPixie16.txt file, the contents of this file should be:
4
Since we are not taking waveform data, there are only 4 longwords of data per channel.
Now that all of the configuration files are correct, you can run the readout program:
cd ~/readout/crate_1
$DAQBIN/Readout
When you ran the ddassetup.bash script to incorporate the DDAS environment variable in your shell, that script also ran the daqsetup.bash script for the version of NSCLDAQ against which the DDAS software was built.
To run the dumper, therefore, you only need to open a new terminal window and type:
$DAQBIN/dumper --count=50
The –count=50 option limits the dumper to dump only the first 50 ring items it sees before exiting.
Start taking data in Readout by switching to that window and typing:
begin
The dumper window should output a lot of text and the dumper should exit back to the shell. Once the dumper exits you can stop data taking by typing
end
in the Readout terminal window.
Let's look at a few events in the dumper terminal window. Note that the actual contents of the event we analyze may be different from what you see in your test, we are only interested in explaining the structure of the event at this time.
-----------------------------------------------------------
Event 24 bytes long
Body Header:
Timestamp:    20924510
SourceID:     0
Barrier Type: 0
000c 0000 0064 0c0c 4020 0008 eda3 001f
0000 1b2f 2970 0000
-----------------------------------------------------------
Event 24 bytes long
Body Header:
Timestamp:    21405220
SourceID:     0
Barrier Type: 0
000c 0000 0064 0c0c 4020 0008 a96a 0020
0000 1bff 2965 0000
-----------------------------------------------------------
Event 24 bytes long
Body Header:
Timestamp:    21885900
SourceID:     0
Barrier Type: 0
000c 0000 0064 0c0c 4020 0008 652e 0021
0000 1ba2 2940 0000
-----------------------------------------------------------
Event 24 bytes long
Body Header:
Timestamp:    22366590
SourceID:     0
Barrier Type: 0
000c 0000 0064 0c0c 4020 0008 20f3 0022
0000 1bdc 296f 0000
First note that the timestamp has been set as the timestamp body header for the event, It is monotonically increasing, as it should be. We'll say more about how the timestamp is derived a bit later.
The first two words of the event body 000c 0000 are the event size in little endian format in 16-bit words. This means that the first word is the least significant part while the second word is the most significant part. The size of all events is 12 words long. The event size includes itself, so the body of the event is 10 words long. Note that data from the digitizer comes in 32-bit longwords. Therefore each pair of values is a digitizer longword. Looking at the last event in the listing above, the remaining words are therefore:
0x0c0c0064    - Module type identification
0x00084020    - Event header.
0x002220f3    - low order timestamp.
0x1bdc0000    - High order timestamp and CFD interpolation.
0x0000296f    - Energy and trace length.
The module type identification has the following fields:
   |  bits         |  Meaning                | Value      |
   +---------------+-------------------------+------------+
   | 0-15          | Sampling freq in Mhz.   | 0x64 = 100 |
   | 16-23         | Bit width of digitizer  | 0x0c = 12  |
   | 24-31         | Module revision number  | 0x0c = 12  |
The key values from this word are that the digitizer runs at 100MHz and waveforms are acquired at 12 bits of precision.
The event header has several bit fields. The table below shows the bit fields and the values they have for this event.
    | bits         |  Meaning                |  Value |
    +--------------+-------------------------+--------+
    | 0-3          | Channel number          |  0     |
    | 4-7          | Slot Identifier         |  2     |
    | 8-11         | Crate ID                |  0     |
    | 12-16        | Header length           |  4     |
    | 17-30        | Event length            |  4     |
    | 31           | Finish code             |  0     |
The following longword is the low order 32 bits of the 48-bit event timestamp. Converted to decimal, this becomes 2,236,649. The actual timestamp placed in the event is in 1ns units. Since our digitizer is 100Mhz (10ns/sample), this is correct.
The next word is divided into two 16-bit fields, The low order 16 bits (0) are the high order 16 bits of the event timestamp. The high order 16 bits (0x1bdc = 7132) is the CFD interpolation value. This is the fraction of a sample time multiplied by 65536. Therefore the CFD zero crossing was interpolated at about .11 samples after the trigger time giving the high precision timestamp of 22366491.1 ns.
To run the readout GUI you must first have set up your account to allow ssh to login via rsa identity keys. If you have not done this yet, see e.g. http://www.linuxproblem.org/art_9.html
cat .ssh/id_rsa.pub | ssh b@B 'cat >> .ssh/authorized_keys'
s simply
cat .ssh/id_rsa.pub >>.ssh/authorized_keys
We're going to set up the ReadoutShell so that it will later run the ReadoutGUI with the NSCL Event builder. While strictly speaking, the event builder is not needed for a single module, normally it is used. This makes the final event structure uniform.
First we'll setup the ddas Readout as a data source. Data sources are programs that are managed by Readout and create data. We're going to use the convention that Readout programs will produce raw data into rings named username_ddas_n where n is the crate number. In our example, the user is 0400x.
Start ReadoutShell:
$DAQBIN/ReadoutShell
Data Source->Add... menu entry to add a new data source.| Field Name | Contents | +-------------- ------+--------------------------------------+ | Host name: | Name of the host in which Readout | | | will run (I used spdaq06). | +---------------------+--------------------------------------+ | Readout Program: | ddas bin dir/Readout I used: | | | /usr/opt/ddas/1.0-000/bin/Readout | +---------------------+--------------------------------------+ | Working Directory | Set this to the directory with the | | | card configuration - uncheck | | | 'Same as readout' and browse to that | | | directory | +---------------------+--------------------------------------+ | Command line options| I used: | | | --ring=0400x_ddas_1 --sourceid=0 | +---------------------+--------------------------------------+
Click the Start button to start your data source (Readout).
Let's test check that all of this works. I ran the dumper as follows:
$DAQBIN/dumper --source=tcp://spdaq06/0400x_ddas_1 --count=50
start a run by clicking the Begin button. Make sure that data is emitted by the dumper. End the run and exit the ReadoutShell.
Starting the event builder is a matter of creating a ReadoutCallouts.tcl script which
Here is an example of a ReadoutCallouts.tcl script that does this for our case:
package require evbcallouts                   (1)


proc OnStart {} {

    EVBC::useEventBuilder                    (2)

    EVBC::initialize -gui 1 -destring 0400x -glombuild 1 -glomdt 10 (3)
}
EVBC::registerRingSource tcp://spdaq06/0400x_ddas_1 \
      $::env(DDAS_LIB)/libddastimestampextractor.so 0 {Crate\ 1\ data} (4)
If we point a dumper to the 0400x ring (the output ring from the event builder), here's a typical event:
-----------------------------------------------------------
Event 76 bytes long
Body Header:
Timestamp:    5991399620
SourceID:     0
Barrier Type: 0
004c 0000 80c4 651d 0001 0000 0000 0000
0034 0000 0000 0000 0034 0000 001e 0000
0014 0000 80c4 651d 0001 0000 0000 0000
0000 0000 000c 0000 0064 0c0c 4020 0008
267a 23b6 0000 1ad3 2943 0000
Let's pick apart the data for this event. Note that it is much bigger than before. This is because the data are framed with a fragment header which also encapsulates a ring item header that in turn wraps the event body. To get on familiar territory, note that in the last lines:
0000 0000 000c 0000 0064 0c0c 4020 0008
267a 23b6 0000 1ad3 2943 0000
Our raw event begins at the word 0x000c. We're going to pick apart the data prior to this, much of which is only relevant if you are using multiple crates. Here is the short summary of the information prior to the raw event:
0x0000004c (32 bits)          -- total event size in bytes.
0x00000001651d80c4 (64 bits)  -- The event builder fragment timestamp.  This is 10x
                                 the digitizer timestamp.
0x00000000 (32 bits)          -- Data source id (value of --sourceid on readout).
0x00000034 (32 bits)          -- Size of fragment payload (not self inclusive)

Next is the ring item header:

0x00000034 (32 bits)         -- Number of bytes in the ring item (self inclusive)
0x0000001e (32 bits)         -- Ring item type (PHYSICS_EVENT).
0x00000014 (32 bits)         -- Number of bytes in the body header.  The body
                                header contains information used by the event
                                builder.
0x00000001651d80c4 (64 bits) -- Fragment timestamp.
0x00000000 (32 bits)         -- Fragment source id.
0x00000000 (32 bits)         -- Fragment body header

0x0000000c (32 bits)         -- First word of the fragment.
Note that if several fragments got glued together to create a single event (as will happen if you tee off your pulser into several channels), there will be a ring item in the fragment body for each fragment that made the coincidence requirement.
SpecTcl is the lab-supported framework for analyzing data online. The DDAS comes with some tools to use in unpacking DDAS data within the context of SpecTcl, DAQ::DDAS::DDASUnpacker and DAQ::DDAS::DDASBuiltUnpacker. These both provide support for parsing the raw data of DDAS for you. It is in your best interest to leverage these tools rather than writing your own parser. To learn how to use the DAQ::DDAS::DDASBuiltUnpacker in your SpecTcl, please refer to Analyzing DDAS Data in SpecTcl Tutorial.
 1.8.8
1.8.8

