6.2. Operating the user interface
Below is a screenshot of the graphical user interface presented by the ReadoutShell program.
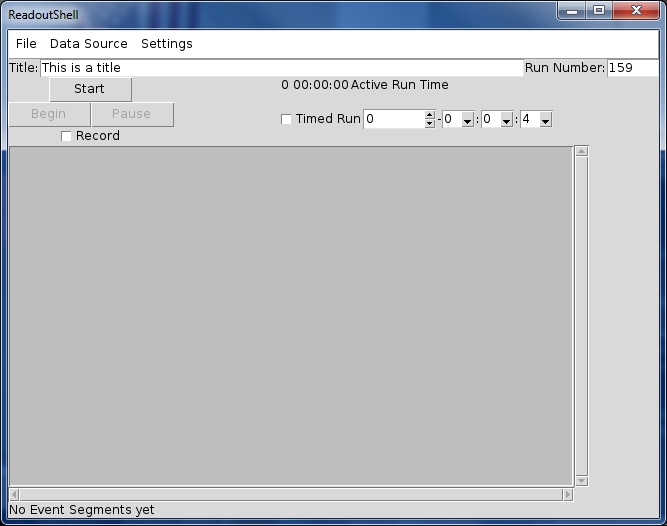
The GUI is divided into four vertically stripped segments. From top to bottom these segments are:
The Menu Bar which provides acces to infrequenly used operations and commands.
The Run management segment which allows you to set up run parameters and to manage the ReadoutShell's state machine as far as you are supposed to be able to stimulate it.
The Output Log window which provides a scrolling text widget in which modules that make up the RadoutShell can place textual messages. In many cases the messages are output in a log/severity format which just means that messages have a timestamp and a severity and that the severity affects the formatting of the messages.
The Status Bar which provides a region for modules that make up the ReadoutShell, and data providers to display status information that will not scroll away.
6.2.1. The Menu bar
The menu bar provides access to ReadoutShell commands that are not as frequently used as those that are presented by the Run Management segment described below. In addtion to the fixed menus described in this section, Customizing the ReadoutShell describes how your extensions to ReadoutShell can add more entries to the menus or create entirely new menus.
The File menu. Provides access to file related commands. The specific operations provided are:
- ->
This command prompts for a file which must be a Tcl/Tk script. The script selected is then sourced into the ReadoutShell. The source is done in global level context.
- ->
This command prompts for a directory. The directory is then added to the path of directories that is searched for Tcl packages. This can be used, for example, to add a directory or set of directories that have data source provider packages to the search path making them known to the data source manager.
- ->
Prompts for a file. Once the file is selelcted, all output sent to the Output Log window is also logged to this file. Logging continues until either the command is seleted, the program exits, or another log file is selected.
If the selected log file already exists, it is opened for append, allowing a single file to easily log the output from more than one session.
- ->
Once seleted, if logging has been established, the log file is closed.
- ->
After prompting for confirmation, exits the ReadoutShell.
The Data Source menu. This menu provides operations that allow you to establishthe set of data sources you will be using and well as to list data sources and their parameterizations.
- ->
Allows you to add a data source to the set of data sources being used by the Readout GUI. This can only be done when the state is not Paused or Active. This also forces all running data sources to stop and transitions the state to the Not Ready state.
Prompting for a data source is a two step operation. First you will be prompted for the Data source Provider (data source type) you want to use. The built in providers are SSHPipe (suitable for Readout programs that operate on the end of an ssh pipeline), S800 which knows how to control the S800 data acquisition system, Delay (used for inserting delay between providers), and RemoteGUI (for remote controlling a ReadoutGUI).
Data sources are parameterized instances of a data source provider. For example, the SSHPipe data source needs to know which host the data source runs in as well as the program to run on the end of the pipe. Optionally it an accept command line parameters for the program.
Once you have been prompted for the data source provider, you will be prompted for its parameterization. The dialog used to prompt for the data source parameterization will appear differently depending on the provider you choose.
- ->
Presents a list of data sources and their parameterizations. You can click on a data source to select it. Click to delete the selected data source or to do nothing.
- ->
Lists the set of data sources you have currently selected for use and their parameterizations.
 | Note |
|---|---|
Data sources set up in the Data source menu are saved and read back in when you next start the ReadoutShell, this means that in general you only have to set up your data sources once. |
The Settings menu. The settings menu currently an -> selection and a -> selection.
The -> selection allows you to configure the shape of the output window, the number of lines of history information retained and accessible through the vertical scroll-bar. A checkbutton also allows you to turn on or off the display of debugging output.
The -> allows you to configure parameters that control the way events are recorded. This allows you to set up a large number configuration parameters for the event logging program. The dialog this menu pops up is a bit complex and therefore will be shown and described below.
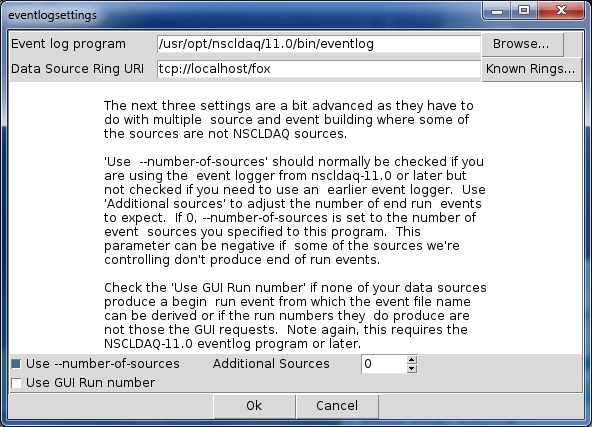
- Event Log Program
This item allows you to select the event logging program. This is normally used either to do NSCLDAQ-8.x event logging via the compatibility tools, or to select the 10.x event logger when using the 11.x ReadoutShell with 10.x software.
The button alows you to graphically select the event logger. You must be sure the event logger will produce event segment files with names that are compatible with what is expected by the ReadoutShell. See the section The event logger and ReadoutShell for more information about this.
- Data Source Ring URI
Allows you to override the ring from which data are logged. Note that if you are using the event builder, it will override this setting using the output ring from the event builder instead of your selection here.
If you click the button, you can choose from a list of rings. This list will include all local rings and all rings remote rings from which data has been accepted previously. It is possible that the ring you want won't be listed (if it is a remote ring from which data has not been taken since the last reboot). In that case you can type in the ring specification which is of the form tcp://host-name/ringname Where host-name is the name of the host on which the ring producer is located and ringname is the name of the ring in that host.
- Use
--number-of-sources This checkbutton causes the ReadoutGUI to use the
--number-of-sourcesoption when starting the event logger. It can only be used with the NSCLDAQ-11.x and later native event logger.This option should be used if you are combining the data from more than one event source using the NSCLDAQ-11.x or later event builder. See eventlog for more detailed information about this option.
- Additional Sources
This option is related to the use --number-of-sources checkbutton and only does something if that box is checked. When use --number-of-sources is checked, the ReadoutShell computes a base source count from the number of data sources it is controlling. The signed value of the Additional Sources field is added to the base source count and used as the value of the
--number-of-sourcesoption when starting the event logger. This value is the number of end run records the event logger will expect to see to indicate all data in a run has been received/recorded.Usually 0 is the right value for this control. If, however you have data sources which are not being managed by the ReadoutShell, you may need to put a positive number in this box. If you have data sources which are managed by the ReadoutShell that don't produce end run records, you may need to use a negative value here to adjust the base source count downward.
The important thing is that the base source count as modified by this value must be the number of active sources that produce NSCL end run records at the end of a data taking run.
- Use GUI Run number
This checkbox determines if the ReadoutShell uses the
--runoption when starting the eventlog program. When this option is used, its value is the value in the ReadoutShell's run number control in the Run management segment of the GUI. That value overrides anything eventlog might see in the data stream and determines the run number field of the filename in the event segments it generates.This checkbutton should normally not be checked. It should only be checked if all data sources are non-NSCL data sources and none of them generate anything like a begin run record that has a run number.
6.2.2. The Run Management segment
Below the ReadoutShell menubar are a set of controls that collectively make up the Run Management segment. These are used to control data taking and the state of the system. Here is a description of the controls and what they do.
- Title
This entry control allows you to type in a title. Titles can only be entered when the state of the system is not Active or Paused. When the state is any of those, the title entry is disabled.
When a run is started, the text in this title field is passed to the data source provider for each data source. It is the responsibility of that provider to know what to do. NSCL data source providers use this to set the title of the run in the data source. For standard NSCL data sources this sets the title of the begin run ring item record. For the S800, this sets the title in the Begin run buffer.
- Run Number
As with the titlwe field, this entry control is only enabled when the state is not Active or Paused. When you navigate focus out of this control, the value of the control is checked and, if it is not a positive integer (0 is legal), an error message pops up and the field is restored to its prior value.
When a run is started, the run number is passed to the data source providers for all data sources. For NSCL data sources this value is passed to the readout program as the run number to place in state transition records.
For the S800 data provider, the run number is passed in and used by the S800 Data source to set the run number in its state transition buffers.
- Run Control cluster
The run control cluster is the set of two or three buttons at the left side of the Run Management segment. The top button of this cluster of buttons is always the button. It is enabled whenever the system is in the NotReady state.
Clicking the button transitions to the Starting state. The data source manager then attempts to start all of the data sources and, if successful, the system transitions to the Halted state.
The button contains a label and state that depends on the systsem state:
The button is disabled when the system is in the NotReady or Starting state.
The button is enabled and labeled Begin when the state is Halted. In this state, when clicked, the system transitions to Active and all data sources are told to start taking data.
The button is enabled and labeled End when the state of the' system is Active or Paused. When clicked in this state, the data sources are told to stop taking data (end the run), and the system transitions to the Halted state.
If all data sources support pausing a run, a third button appears in this cluster. The third button is the button.
This button is disabled when the system is not in the Active or Paused state.
This button is enabled and labeled when the system is in the Active state. If clicked in that state, the system transitions to the Paused state and all data sources are instructed to pause data taking but keep the run alive.
This button is enabled and labeled . Clicking this button transition to the Active state after instructing all data sources to resume data taking in their paused run.
This is located below the Run control cluster. It is enabled only when the state is not Active or Paused when checked, the next begin run will also initiate the event logger as configured by the -> menu item.
- Active Run Time
This is located to the right of the button. This represents the elapsed time of the current or most recent run. The timer is cleared when a run begins, pauses when a run is paused and runs when in the Active state.
- Timed Run Controls
This set of controls is located to the right of the and (if visible) buttons. The controls consist of two segments:
A Timed Run checkbutton which, when checked automatically ends a run when the Active run time counter reaches the selected length
A set of drop downs that allow you to select the length of time a run will be active if timed.
6.2.3. The Output Log window
The output log window provides a scrolling window for messages from components of the ReadoutShell and data sources. Must but not all messages will include a timestamp as well as a logging type. The log type may also carry some visual form of emphasis.
Note that when event logging is active, the background of ths window is Spartan Green, otherwise it is grey.
Unless otherwise noted below, log entries are in black text on the current background. The log types are currently:
- debug
The debug log level is intended to provide debugging/tracing information that shows programmers the internal operation of components of the ReadoutShell. By default these log entries are not displayed. See, however OutputWindow for information on how to make these visible.
- log
Log entries at the log level log a significant event that represents the normal operation of the program.
- output
output log entries capture output from a program that is being run under the control of the ReadoutShell (usually a data source).
- warning
warning log entries are intended to warn you of an unusual condition. They are displayed in magenta text on the current background.
- error
error log entries are intended to inform you of a problem. A typical cause of an error is the unexpected exit of a data source. Error log messagesa are displayed in red on a white background.
The log types and their visual representations can be controlled programmatically. See OutputWindow for information that describes how to locate the output window widget and the interfaces it provides.
6.2.4. The Status Bar
At the very bottom of the ReadoutShell GUI is the status bar. This is used by components of the ReadoutShell and its extensions to provide status information about their operation that should not scroll out of the visible part of the Output Window. Currently the only use of the status bar by the core ReadoutShell components is to display the event recording status of active runs.