

 |  |  | Using Xamine |  |
This section describes how to use Xamine, the NSCL Spectrum Display program. It is beyond the scope of this document to describe all of the features of the Xamine program. A full user manual is available at: [tp://ftp.nscl.msu.edu/pub/daq/doc/xamine_user.ps] [ftp://ftp.nscl.msu.edu/pub/daq/doc/xamine_user.ps] (warning, this manual is about 130 pages long).
In this section you will learn:
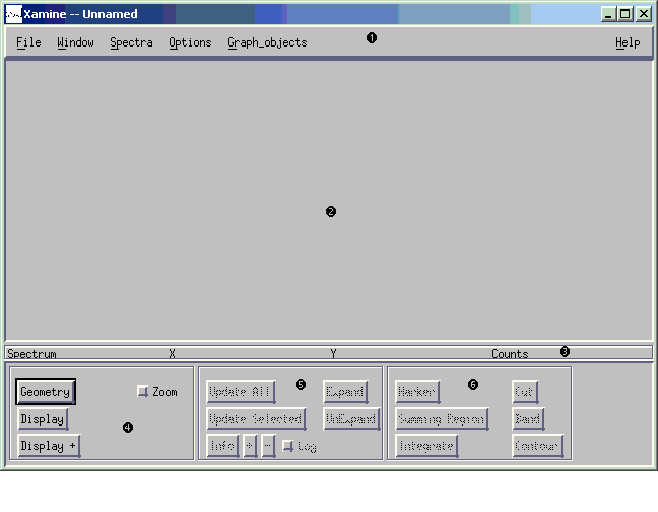
The figure below shows the Xamine user interface. The window can be stretched as desired to provide more spectrum display room.

As you read the text below, note that the numbers refer to the numeric labels on the figure.
Take some time to explore the Xamine GUI as the software has quite a bit of functionality that we will not describe in this document.
Xamine can display up to 100 spectra. This is accomplished by:
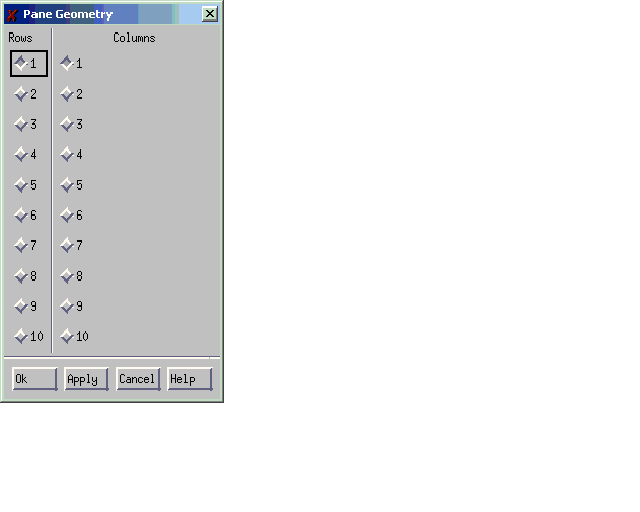
Click on the Geometry button (note that any spectra that are displayed are removed from the display whenever the geometry is changed). You will see the following dialog. Note that all Xamine dialogs are non-modal, if you have the screen space and will be interacting with a dialog several times feel free to leave it posted on the screen.

To set a geometry, use the radio buttons to select the number of rows and columns you want. Click ok to accept and dismiss the dialog (click apply to accept and keep the dialog posted). click Cancel to do nothing.
The SpecTcl display area is now divided as you have requested. Each box in the display area will be referred to as a pane. One pane is always rendered to look like it is pressed in. This pane is called the selected pane. All operations on single spectra are performed on the selected pane.
Single clicking on pane selects it. Double clicking a pane selects it and toggles between zoomed and unzoomed display. Zoomed display only displays the selected pane. Unzoomed displays them all. The zoom checkbox can also be used to flip back and forth between zoomed and unzoomed.
Once you have selected a pane geometry, you will want to display spectra in the panes of this geometry. To do this you will:
The differences between the Display and Display+ buttons are:
You will often want to modify the characteristics of a spectrum so that you can see the features you are interested in. This section will describe how to set the characteristics that are available on the short cut buttons.
To update the selected pane, click the Update Selected button. To update the contents of all panes, click the Update All button. A periodic update rate can be set using the properties dialog in the Spectra->Properties menu entry and the Options->Update Rate... menu entry.
To change the full scale of a spectrum, use the + and - buttons. These buttons rescale the spectrum to move the peak height in the direction implied by the button label. Thus + actually decreases the full scale and - increases the full scale.
Given a pane that is displaying a spectrum, you can display a region of interest within that spectrum using the Expand button. A region of interest is a slice of the spectrum between lower and upper limits for a 1-spectrum. For a 2-d spectrum, a region of interest is the interior of a rectangle defined by two points on one of its diagonals.
Click on the Expand button. Xamine will display the expand dialog.
Click the limits of the region of interest in the spectrum. If you click on a spectrum that is not selected, any points you have acceped are lost and the new spectrum is selected. Click on Ok or Apply to accept your points and display only the region of the spectrum between them.
Once expanded, you can re-display the entire spectrumby clicking on the Unexpand button.
You can integrate regions of interest on 1 or 2 dimensional spectra. The Xamine nomenclature for a region of interest is Summing Region. Summing regions are a kind of graphical object that is created on a spectrum pane and remains in place until deleted. Summing regions are associated with a spectrum and will be displayed any time that spectrum is displayed in a pane.
To accept a summing region:
To perform an integration, click on the Integrate button. A text box will pop up to show the results of the integrations on all summing regions and elligible gates in the selected spectrum. If you do another integration without dismissing the text box, the results will be appended to the text box so that you can compare them.
Note that if you eventually decide to use gates, Integrate will also integrate cuts and contours.
Spectra can be printed. Use the File->Print... menu to bring up the print dialog. Fill it in as desired (you may need to ask NSCL staff which printers are available and best for you). Click ok to dismiss and print.
Normally you will create several geometries, with different sets of spectra. Each of these (geometry + layout) is called a Window definition. For example, you may have one window definition that displays the key ppac spectra, and another that displays the scintillator spectra.
It would be painful to have to re-create each window definition every time you needed it. Therefore, Xamine allows you to save window definitions to file. Saved window definition files can then be re-loaeded.
To save a window definition file:
To restore a window definition file:
 |  |  | Using Xamine |  |