Chapter 2. Parallel SpecTcl: an introduction
The idea of developing a version of SpecTcl that could take advantage of the now common multi-core machines came from basic need of being able to handle high data rates experiment in perspective of the upcoming FRIB era. In alternative to Batch/MPI SpecTcl, which doesn't offer interactivity, Parallel SpecTcl allows to monitor online parameters just like the normal SpecTcl. Furthermore, it adds computation flexibility when needed (see later for details on worker-driven load-balancing pattern) and speeds up by order of magnitudes offline analyses when recorded files are loaded. The whole phylosophy behind this choice followed the efforts to upgrade the whole DAQ readout/analysis to a more modular and parallel system.
To understand how Parallel SpecTcl works, let's schematize how the "normal" SpecTcl works (see Figure 2-1). Underneath SpecTcl, a Tcl loop defines the "time" in which events are analyzed. Every second, on an event-by-event base, a buffer of data goes through the SpecTcl analysis engine, is read, unpacked, and histogrammed. What I call engine is a trifecta of C++ classes that interact with each other: a buffer decoder, an event unpacker, and an analyzer. Being a single-core application, the processing speed is defined both by the processor itself and the I/O throughput. It is possible to analyze up to 100 MB/s of data, with the side note that this number is highly dependent on the complexity of the analysis pipeline. In this version of SpecTcl, the Tcl timing loop and the buffer size dictate the analysis and histogramming speed.
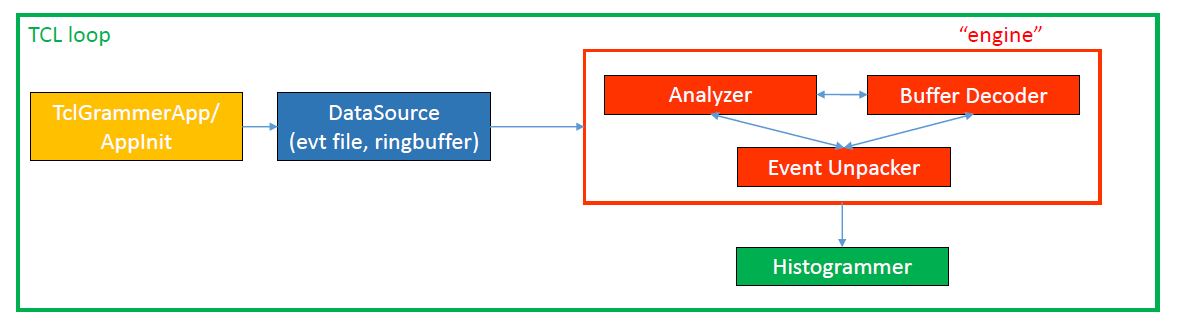
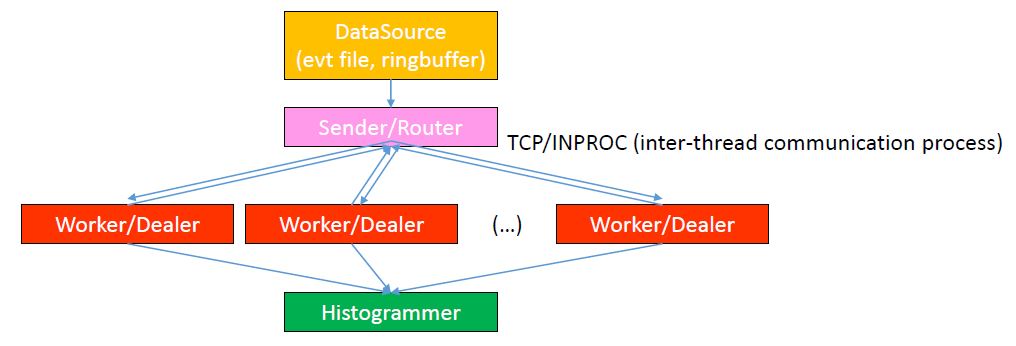
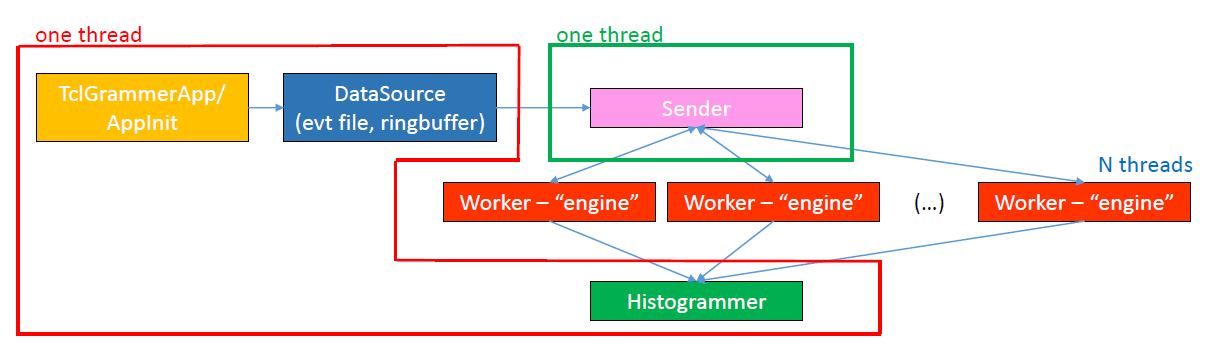
Figure 2-2 shows the working components of Parallel SpecTcl. As one can see, the main components are still the same. A regrouping of the processing operations and the introduction of a "sender" determine the work flow. Also, the main noticeable difference is the proliferation of "engine" units. Contrary to SpecTcl, Parallel SpecTcl does not run on a single thread. To be able to run an analysis pipeline one needs at least three threads: 1) the main thread that deals with starting the app, attaching the datasource (either online or evt file), and finally histograms the spectrum 2) the "sender" thread that handles and sends the events to the worker units 3) the worker unit with the "engine" that performs the analysis. Another major different with SpecTcl is the fact that there is not Tcl loop dictating the timing. The whole analysis process is driven by the workers, so the computation speed is determined by the disk/memory access to read buffers of data and the number of the worker units instantiated. The average processing speed varies from hundreds of megabytes per second to gigabytes per second (if memory caching effects kick in).
The event handling between the sender and the worker units occurs via an asyncronous messaging library (ZeroMQ). The design pattern of choice for the communication is a router-dealer one, which allows a worker-driven load-balance between all the workers allocated without wasting computational resources. The router-dealer messaging pattern algorithm is showed in Figure 2-3. Each worker unit, when instantiated, sends a "ready" message to the sender. Upon receiving, the sender reads a "chunk" of data (configurable via SpecTclInit.tcl - see later for details), formats it as a message, and pushes it to the worker on a first-come-first-served base. Each worker then attaches to the main thread for histogramming. The process goes on until no data is available: at this point the sender sends and "end" message to the workers that will automatically shutdown. The elapsed time, the average processing rate, and the total number of processed events is displayed in the gui in real time.