Chapter 4. Plotting window
The plotting window is characterized by a tab system that allows users to load different geometry windows and quickly switch from one to the other. On the top left, from left to right:

Home button: returns to the original format of the spectrum.
Magnifying glass: allows to interactively select and magnifying a region in the plot.
3.5'' Floppy disk: saves the figure into a graphics format (jpg, png).
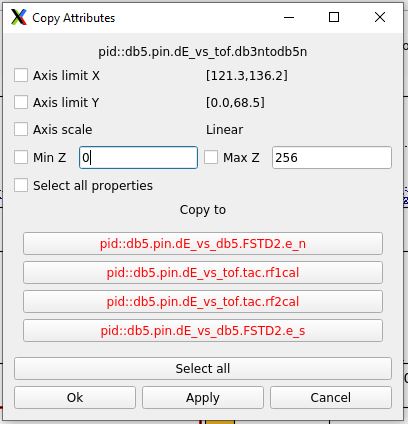
Copy Properties: opens a popup window with several options
The pannel automatically fills information for the selected plot, allows to select what property needs to be copied to a clickable list of histograms of the same dimensions (1D or 2D).Summing region: please see next chapter for more details on how to enable it.
Histogram name: updated by hovering the mouse to the corresponding histogram.
Log and Autoscale: self scaling feature for a selected histogram. Autoscale applies automatically to all the histograms.
+/- buttons: for a selected spectrum, it zooms in/out (i.e. 1D: modifies the y scale by a factor of 2, 2D: modifies the z scale by a factor of 2)